CSDS POLICY BRIEF • 15/2025
By Daniel Fiott
28.5.2025
Key issues
- The European Defence Fund (EDF) has been in operation since 2021 and has become an integral part of European efforts to enhance defence investments.
- Since 2021, the European Commission has invested €4 billion into 225 collaborative defence research and development (R&D) projects.
- A major challenge will be keeping the momentum by securing more funding for the EDF under the next Multi-annual Financial Framework (MFF).
Introduction
In May 2025, the European Commission released the results of the fourth call for projects under the European Defence Fund. Since 2021, the European Commission has invested approximately €4 billion into 225 individual collaborative defence R&D projects. This means that the European Commission is today one of Europe’s largest investors in defence R&D. With much of the political focus now being directed to new initiatives such as the Security Action for Europe (SAFE) or the European Defence Industry Programme (EDIP), it is easy to lose sight of the contributions of the EDF. Indeed, the Fund is not only important in terms of the additional investment it brings to European defence R&D, but also in the way that it demonstrates that EU-level institutions can effectively manage collaborative defence projects in partnership with the member states, industry and research institutes.
Using the publicly available data on the EDF produced annually by the European Commission, this CSDS Policy Brief provides an analysis of the EDF between 2021 and 2024 by looking at investment priorities and collaboration under the Fund. In particular, we uncover novel ways of looking at the results of the EDF including a ranking of the most heavily involved entities and a preliminary trend of how member states, industry and research institutes engage with the Fund. The data was collected by this analyst, and all faults lie with the author and not the European Commission.
After four years, where is the investment going?
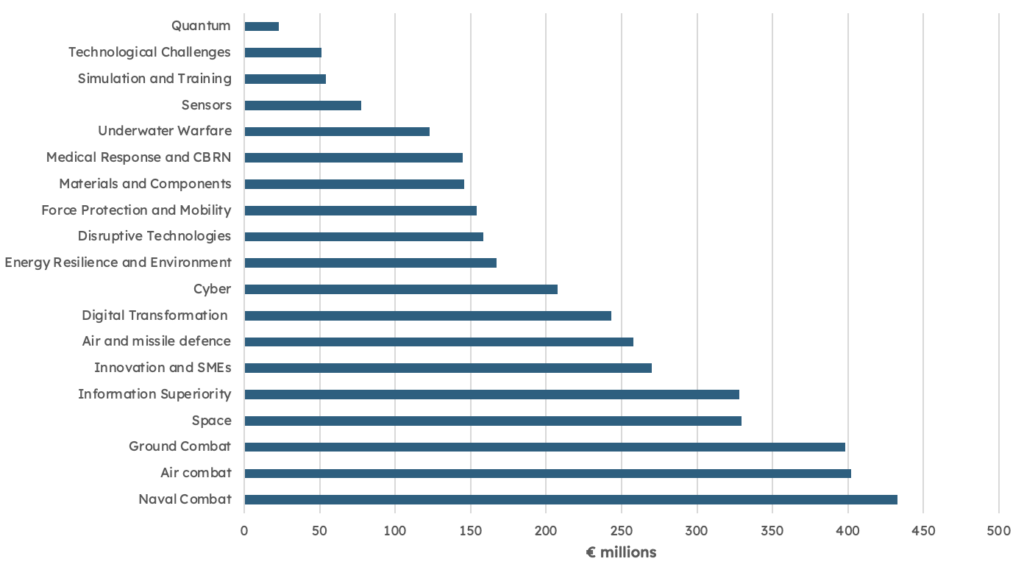
When analysing EDF projects since 2021, the Commission has prioritised European Union (EU) investments in air combat (representing 2.2% of overall projects since 2021), air and missile defence (1.7%), cyber (3.1%), digital transformation (8%), disruptive technologies (9.3%), energy resilience and environment (2.6%), force protection and mobility (2.6%), ground combat (5.3%), information superiority (5.3%), materials and components (3.5%), medical response and CBRN (4%), naval combat (3.1%), innovation and SMEs (30.2%), sensors (2.2%), simulation and training (1.3%), space (2.6%), quantum (1.3%) and underwater warfare (2.2%). Although the project category “Innovation and SMEs” has made up the majority of EDF projects since 2021, the picture is different when one considers the total EU funding contributions to each area. Indeed, the largest slice of the Fund since 2021 has been invested in naval combat (€432.9 million), air combat (€402 million), ground combat (€398.4 million), space (€329.4 million) and information superiority (€328.1 million) – see Figure 1 for the overall amounts.
Figure 1 – EDF projects and values by investment areas
Source: European Commission, 2022, 2023, 2024, 2025
The amount of projects funded by the EDF in each year has remained stable at approximately 60 projects – except for 2022 when there were 41 projects –, but the number of participants involved in projects has decreased in 2024 when compared to past years. Indeed, while there were 785 participants involved in the 41 projects in 2022, in 2021 there were 869 participants and in 2023 there were 867 participants. In 2024, however, there were only 777 participants even though this was a record year for projects (a total of 62 projects). How can we explain this drop and is it necessarily a negative development? One explanation could be that entities in the EU, already involved in multiple EDF projects from previous years, may not have the administrative or technical bandwidth to take on more projects. However, it is not possible to concretely assert this point without a longer trendline of data, especially given that several EDF participants since 2021 have the benefit of having learned more about the Fund and its bureaucratic norms and procedures.
Another potential explanation is that project coordinators have realised that a fewer number of participants is easier to manage in each EDF project, although this would also need to be tested over multiple years to draw any concrete conclusions. In fact, the data shows that since 2021 the average number of entities per project has remained rather stable with an average of 15 entities per EDF project. In fact, in 2021 the average size of project consortia was 14 entities, in 2022 this grew to an average of 19 entities per project, in 2023 this number fell back to an average of 14 entities and in 2024 the number fell to an average of 12 entities per project. To date, the EDF project with the highest number of participating entities is the 2022 French-led “Resilience” project on medical response and CBRN with 92 participating entities, followed by the 2023 “Marte” ground combat project led by Germany, with 47 participating entities. However, in 2024 a number of projects almost equalled this total with the Italian-led “Auriga” project on ground combat and the French-led “ENGRT II” project on air combat having 46 and 45 participating entities, respectively.
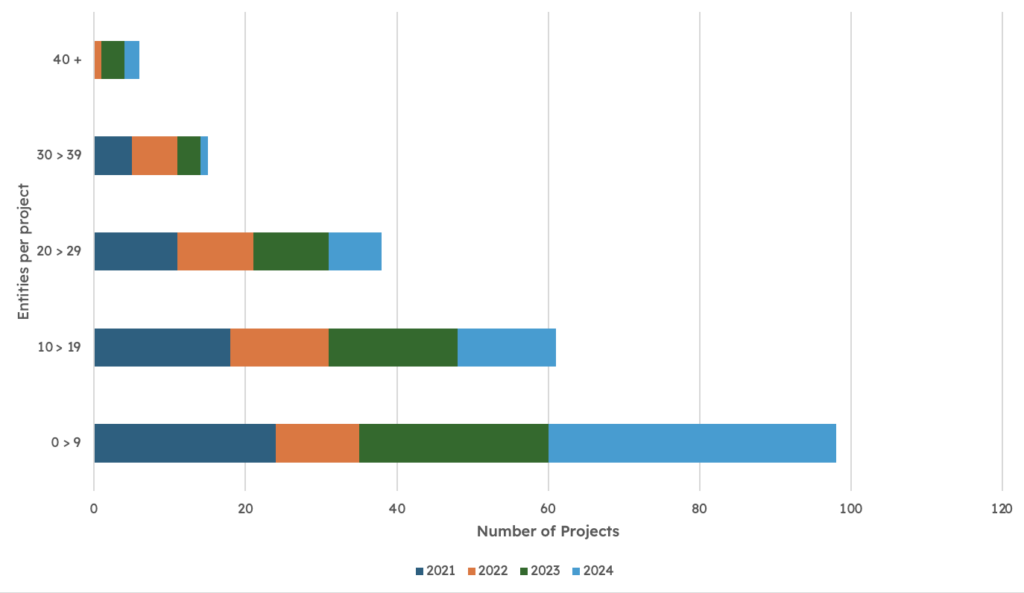
Figure 2 – EDF project consortia data
Source: European Commission, 2022, 2023, 2024, 2025
Digging deeper into the data since 2021, however, it is clear that EDF projects tend to contain fewer rather than more entities. Even if the average EDF project size since 2021 is 15 entities, there has been a decrease in the total number of EDF projects containing 30 or more entities. As Figure 2 shows, 23 projects since 2021 have contained 30 or more entities (17 projects contained between 30 and 39 entities, and 6 projects contained 40 or more entities). Here, there were 5 such project consortia sizes in 2021 and 7 in 2022, but this fell to 6 in 2023 and then 3 in 2024. In contrast, since 2021 a total of 38 projects have contained between 20 and 29 entities, but, again, here the prevalence of this project size has decreased from 11 in 2021 to 7 in 2024. Additionally, 61 projects since 2021 have contained between 10 and 19 entities, and this number has also decreased from 18 such sized projects in 2021 to 13 in 2024. The most popular consortia size is between 0 and 9 entities and since 2021 98 such projects have been created. Yet here, in contrast to other consortia sizes, there has been a proliferation of projects from 24 such sized project consortia in 2021 to 38 in 2024.
After four years, who is benefitting?
When looking at the data since 2021, it is clear that the Fund is managing to benefit a range of entities including prime firms, research institutes, government bodies and SMEs/start-ups. As Table 1 shows, it is the prime defence firms that are most present across EDF projects and these firms come from the largest defence producers in the EU. Hence why we see Thales, Leonardo, Indra, Saab, Safran, Rheinmetall, Airbus and other primes at the summit of Table 1. However, we also observe that some of Europe’s leading research and technical institutes are present in many projects including TNO, the Austrian Institute of Technology, the Forsvarets Forskninginstitutt and the Totalforsvarets Forskningsinstitut. Interestingly, we can also see in the case of France that national government agencies and bodies participate in a relatively higher number of EDF projects than even some firms or research institutes. Since 2021, universities have played a steadily important role in projects. There are currently 104 individual universities from across the EU and Norway involved in EDF projects. Italy has the highest concentration of universities involved in EDF projects at 17 universities followed by Spain with 16, France with 12, Germany with 10 and Greece 9.
Table 1 – Top 20 List of Entities per Country, 2021-2025
| Entity |
Country |
Total Projects |
| Thales Group |
France |
85 |
| Leonardo |
Italy |
60 |
| Indra |
Spain |
53 |
| Fraunhofer |
Germany |
48 |
| Saab Group |
Sweden |
42 |
| TNO |
Netherlands |
41 |
| Safran Group |
France |
35 |
| Austrian Institute of Technology |
Austria |
34 |
| Rheinmetall |
Germany |
34 |
| Elettronica |
Italy |
26 |
| Airbus Defence and Space |
Germany |
25 |
| Office National d’Études et de Recherches Aérospatiales |
France |
24 |
| Commissariat à l’Energie Atomique et aux Énergies Alternatives |
France |
24 |
| Forsvarets Forskninginstitutt |
Norway |
23 |
| Hensoldt Group |
Germany |
22 |
| GMV Aerospace and Defence |
Spain |
21 |
| Naval Group |
France |
19 |
| Totalforsvarets Forskningsinstitut |
Sweden |
19 |
| Kongsberg |
Norway |
19 |
| Intracom Defence |
Greece |
18 |
Data source: European Commission, 2022, 2023, 2024, 2025
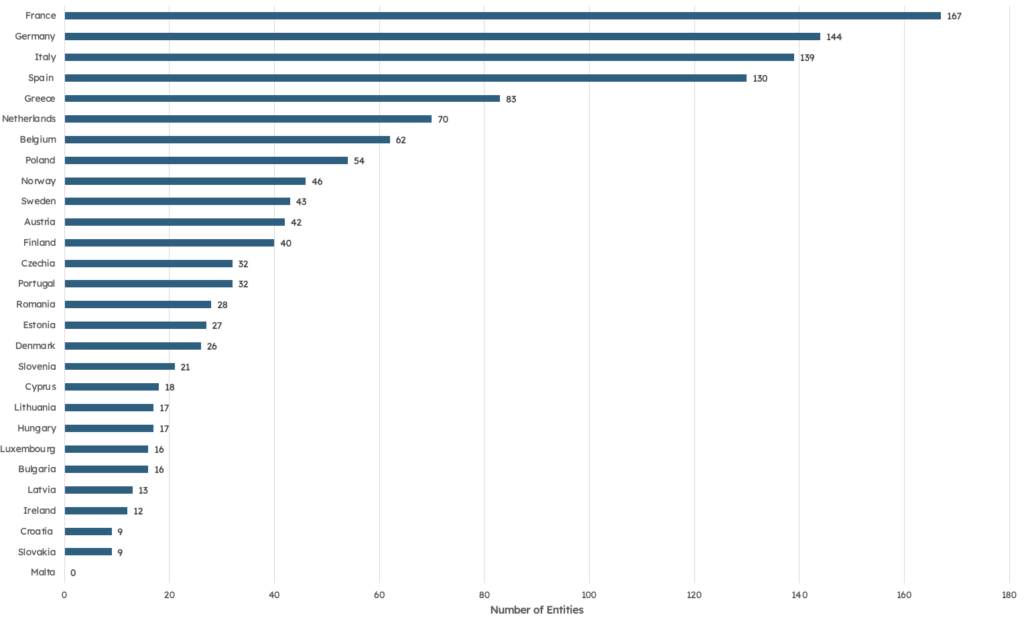
Overall, the data reveals that the member states with the largest defence technological and industrial bases are best represented in EDF projects – this is an obvious conclusion given the size of their respective defence markets. As Figure 3 shows, there are more French entities in EDF projects than any other member states with 167 entities across the 2021-2024 period. France is followed by 144 German entities, 139 Italian entities and 130 Spanish entities. After Spanish entities, we observe Greece (83 entities), the Netherlands (70), Belgium (62), Poland (54), Norway (46) and so on. The only EU member state that has not taken part in any EDF projects to date is Malta, but above Malta sits Slovakia (9 entities in EDF projects from 2021-2024), Croatia (9), Ireland (12) and Latvia (13).
Figure 3 – EDF entities per member state/third country
Source: European Commission, 2022, 2023, 2024, 2025
When it comes to the participation of those EU member states with smaller defence industrial bases, the data points to increased participation. For example, 15 Cypriot entities participated in EDF projects in 2021, but in 2024 this increased to 24 entities. The same is true of Estonia, with an increase from 13 to 19 entities from 2021 to 2024. Over the same time period (2021-2024), there were other notable increases in the cases of Finland (17 entities to 23), Latvia (5 to 10), Lithuania (11 to 16), Luxembourg (4 to 9), Portugal (9 to 12), Romania (10 to 14) and Slovenia (12 to 14). Those EU member states that have witnessed a chronic lack of participation include Croatia, Ireland, Slovakia and Malta. Finally, non-EU member state Norway has been a regular participant in EDF projects and it has also witnessed an increased level of participation. 29 Norwegian entities took part in EDF projects in 2021, but this increased to 31 entities in 2024.
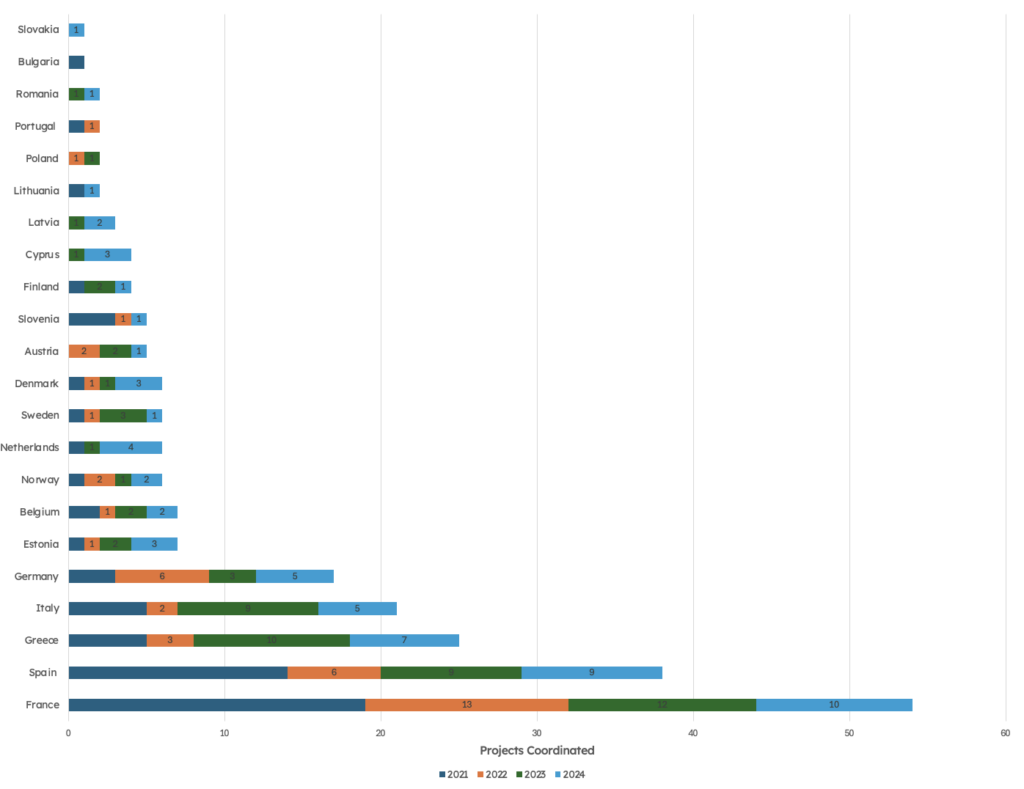
To conclude, another important feature of EDF projects is how entities from EU member states position themselves to coordinate or manage projects. Under the Fund, coordinators play a key role in managing initial bids to the European Commission and, if they are successful, with the management of EDF projects all the way to completion. Here, Figure 4 reveals that the major EU member states coordinate the most EDF projects with France in the lead with 54 projects followed by Spain with 38 projects; Greece with 25 projects; Italy with 21 projects; Germany with 17 projects; Belgium and Estonia coordinating seven projects each; Norway, the Netherlands, Sweden and Denmark six projects each; Austria and Slovenia with five projects each; Finland and Cyprus with four projects each; Latvia with three projects; Lithuania, Poland, Portugal and Romania coordinating two projects each; and Bulgaria and Slovakia coordinating one project each.
Figure 4 – EDF project coordination, 2021-2024
Source: European Commission, 2022, 2023, 2024, 2025
Conclusion
After four individual calls for proposals since 2021, it is clear that the European Defence Fund is becoming an important investment stream for European defence R&D. What is more, it can no longer be said that EU-level institutions such as the European Commission are unable to manage relevant defence projects in cooperation with EU member states, even if the management of common joint defence procurement programmes is more demanding than defence innovation projects. Based on the available public data provided by the European Commission since 2021, it is clear that the EU has developed a unique way of investing in defence R&D projects that brings together the Commission, EU member states, defence firms and research institutes in novel ways. What is also clear is that the Fund has enabled a much higher level of European cooperation in the area of defence R&D and entities such as primes, SMEs, technical institutions and research bodies from various member states and partners are working together in a concerted way. This is positive news overall and it will certainly help make the case for additional funding under the European Defence Fund after 2027.
__________
The views expressed in this publication are solely those of the author and do not necessarily reflect the views of the Centre for Security, Diplomacy and Strategy (CSDS) or the Vrije Universiteit Brussel (VUB).
ISSN (online): 2983-466X